An NPS survey asks one question — "How likely are you to recommend us to a friend or colleague?" on a 0–10 scale — and turns the answers into a single loyalty score, the Net Promoter Score. It's the most copied metric in customer feedback, and the most casually misused.
This guide is about running NPS on your website: the score itself, the follow-up question that's worth more than the score, and the targeting rules that decide whether your responses mean anything. If you're after general-purpose feedback questions — bug reports, feature requests, "how was your experience" — start with our website feedback survey guide instead. This one goes deep on a single instrument.
Key Takeaways
- The score is arithmetic, not magic. Promoters (9–10) minus detractors (0–6), as percentages. Passives (7–8) dilute both sides. Range: −100 to +100.
- The follow-up "why?" is the product. The number tells you something moved; the open-text answers tell you what to fix. Never ship the scale without it.
- Timing decides validity. Ask after a completed purchase or on a return visit — never on first landing — and cap it so nobody is asked twice in a quarter.
- Trend beats absolute number. On-site samples are small and biased; compare this quarter to last quarter, collected the same way, and ignore other people's benchmarks.
- The loop must close. An optional email field turns anonymous detractors into recoverable customers and promoters into review-writers — if you actually follow up.
What is an NPS survey?
NPS, in two sentences
Net Promoter Score (NPS) measures loyalty by asking one question — "How likely are you to recommend us to a friend or colleague?" — answered on a 0–10 scale. Respondents are grouped into promoters (9–10), passives (7–8) and detractors (0–6), and the score is the percentage of promoters minus the percentage of detractors.
The question works because it isn't about satisfaction — it's about risk. Recommending something to a friend puts your own reputation on the line, so people answer it more conservatively than "are you satisfied?". That conservatism is deliberate, and it's why the thresholds look harsh:
- Promoters (9–10) — enthusiasts. They'd stake their name on you. These are the people who write reviews, refer friends and forgive your mistakes.
- Passives (7–8) — satisfied but unattached. A 7 sounds like a good grade; in NPS it means "fine, until a competitor runs a promotion". Passives count toward the total but not toward the score — they dilute it.
- Detractors (0–6) — everyone from mildly disappointed to actively angry. A 6 out of 10 feels generous to the person giving it and counts fully against you. That's the point: lukewarm is a warning, not a pass.
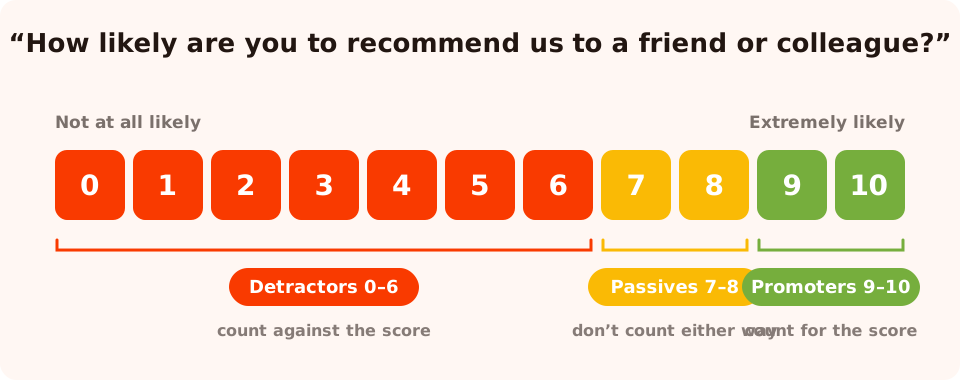
The 0–10 NPS question and its three zones. Note how much of the scale counts against you — a 6 is a detractor.
Traditionally NPS is collected by email, long after the fact. Running it on-site — as a small survey overlay on your own pages — trades some of that distance for immediacy: you catch people while the experience is fresh, you reach customers who never open marketing email, and you control exactly who sees the question and when. The rest of this guide is how to use that control well.
How to calculate NPS
The formula is one subtraction:
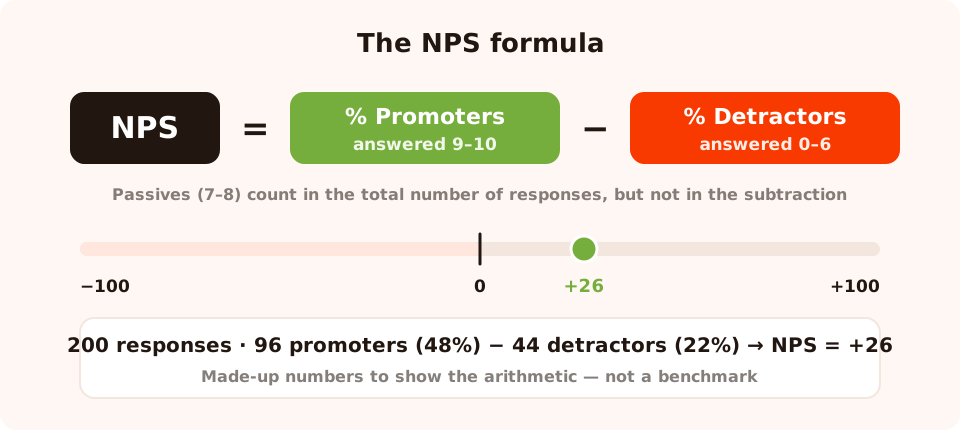
NPS = %promoters − %detractors. Passives sit in the denominator but not in the subtraction.
Step by step, from raw answers to a score:
- Count every response to the 0–10 question in your reporting window.
- Bucket them: 9s and 10s are promoters, 7s and 8s are passives, 0 through 6 are detractors.
- Convert to percentages of the total — passives included in the total.
- Subtract: %promoters − %detractors. Drop the % sign; NPS is quoted as a plain number, usually with its sign ("+26", "−12").
A worked calculation — illustrative numbers, not benchmarks. Say a quarter brings in 200 responses: 96 people answered 9 or 10, 60 answered 7 or 8, and 44 answered 0–6. Promoters: 96 ÷ 200 = 48%. Detractors: 44 ÷ 200 = 22%. NPS = 48 − 22 = +26. The 60 passives appear nowhere in the subtraction — but if twenty of them had answered 9 instead of 8, the score would jump to +36 without a single detractor changing their mind. Passives are your cheapest upside.
The range runs from −100 (every respondent is a detractor) to +100 (every respondent is a promoter). Anything above zero means promoters outnumber detractors. And note a property that surprises people: two companies can share the same score with completely different realities — 50% promoters and 30% detractors is +20, and so is 20% promoters and 0% detractors. Always look at the three buckets, not just the difference.
Where the arithmetic happens in ChilliPopup: the dashboard shows your survey's responses, its funnel and a collected-fields breakdown with the count of each 0–10 answer — it doesn't compute the NPS score for you. Copy the answer counts into a spreadsheet and apply the subtraction above. Two minutes a month, and it forces you to look at the distribution instead of a single number, which is exactly the habit you want.
The follow-up question matters more than the score
Here's the uncomfortable truth about NPS: the score, on its own, is almost useless for deciding what to do next. It tells you loyalty moved; it cannot tell you why. A dip could be shipping delays, a price change, a redesign people hate or a run of bad support days — the number is identical in all four cases.
That's why every serious NPS survey is really two questions. Right after the 0–10 scale, ask one open-text follow-up:
"What's the main reason for your score?"
That phrasing is deliberate. It's neutral — it reads correctly whether the person just tapped a 2 or a 10, which matters because on-site surveys show every respondent the same steps in the same order. There's no branching by score, so don't write "What went wrong?" (insulting to a promoter) or "What do you love about us?" (absurd to a detractor). One neutral question serves both.
Three rules for the follow-up:
- Keep it optional. A required text box costs you scores from people who can't be bothered to type. Let the number be the floor and the comment be the bonus.
- Ask for "the main reason", singular. It nudges people toward the one thing that drove the score instead of a vague ramble — and one clear reason per respondent is exactly what you'll tally later.
- Read them raw, in batches. Once a month, read every comment and tally the recurring themes by bucket. When detractor comments cluster around one theme, that theme is your roadmap — no dashboard required.
Rule of thumb: the score is for the leadership slide; the follow-up answers are for the fix list. If you only have room for one, keep the follow-up and drop the score — never the other way round.
NPS vs CSAT vs CES vs stars vs thumbs
NPS is one scale among several, and picking the wrong one is the most common feedback mistake we see. Each scale answers a different question — choose by the question you actually have, not by which acronym is fashionable. (In ChilliPopup all five ship as variants of the same scoring block, so switching is a dropdown, not a rebuild.)
| Scale | The question it answers | Range | Best moment to ask | Watch out for |
|---|---|---|---|---|
| NPS | "Are they loyal to the brand as a whole?" | 0–10 → score −100..+100 | Periodically, after real experience — post-purchase, returning visitors | Meaningless on strangers; needs the follow-up "why?" to be actionable |
| CSAT | "Was this specific interaction good?" | 1–5 | Immediately after the event — a delivery, a support reply, a checkout | Grades the moment, not the relationship; recency skews it happy or angry |
| CES | "How hard did we make them work?" | 1–7 (customer effort) | Right after a task — finding a product, returning an item, setting something up | Only meaningful tied to one named task; useless as a general vibe check |
| Star rating | "How would they grade this item?" | 1–5 stars | Rating a concrete thing — a product, an article, a recipe | Everyone reads stars through review-site glasses; averages cluster high |
| Thumbs | "Did this help — yes or no?" | Up / down | Inline, zero-friction — help articles, docs, FAQ answers | No nuance at all; great for volume, useless for diagnosis |
The practical takeaway: CSAT and CES grade touchpoints; NPS tracks the relationship. A visitor can rate your delivery 5/5 (CSAT) the same week their loyalty quietly erodes over pricing — and a loyal promoter can have one bad support day. Most sites end up running both layers: quick CSAT or thumbs at the touchpoints, plus a quarterly-capped NPS survey for the relationship. What you shouldn't do is run NPS as a touchpoint survey — "how likely are you to recommend us" makes no sense thirty seconds after someone's first pageview, and the answers you'd collect there are noise.
How to build an on-site NPS survey in ChilliPopup
In ChilliPopup, an NPS survey is a survey — multi-step content that runs as a triggered overlay with the same display rules as a popup, and can also be shared as a hosted link or embedded inline on a page. Steps run in order: a start screen, your question steps, a thank-you screen. Thirty minutes, no code. (No pixel on your site yet? The help center has one-line install guides for every platform.)
1. Create the survey and its steps
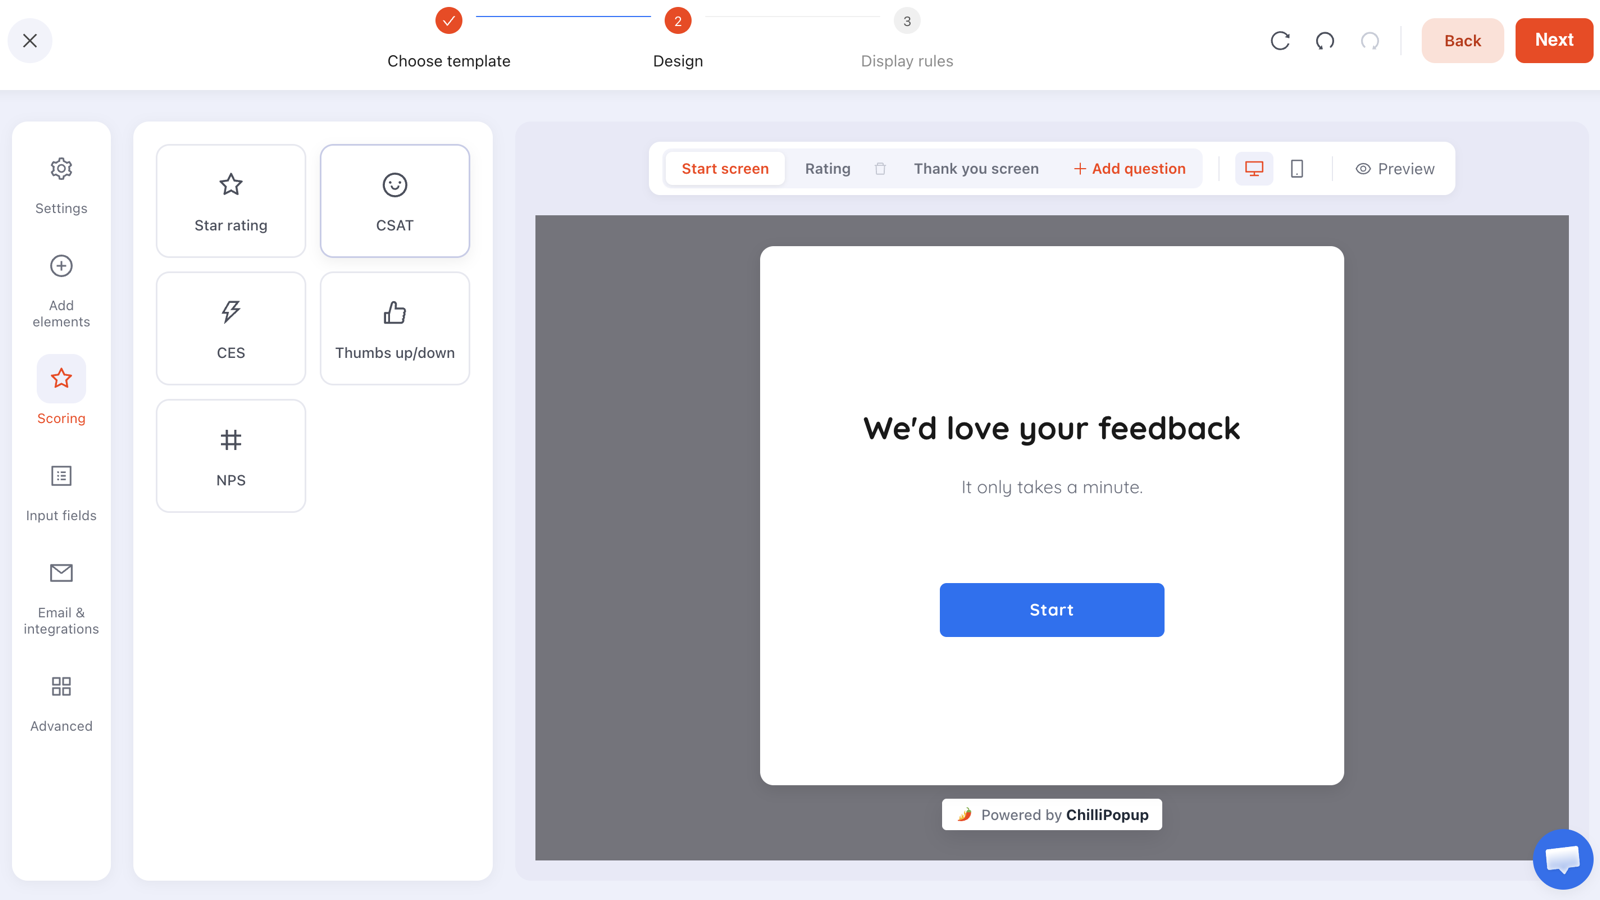
Create a new survey with five steps: a lean start screen, the NPS question, the follow-up, an optional email step, and a thank-you screen. Keep the start screen honest and tiny — "Got 20 seconds? One question." — or describe the whole thing in a prompt and let the AI generator draft it for you, then edit.
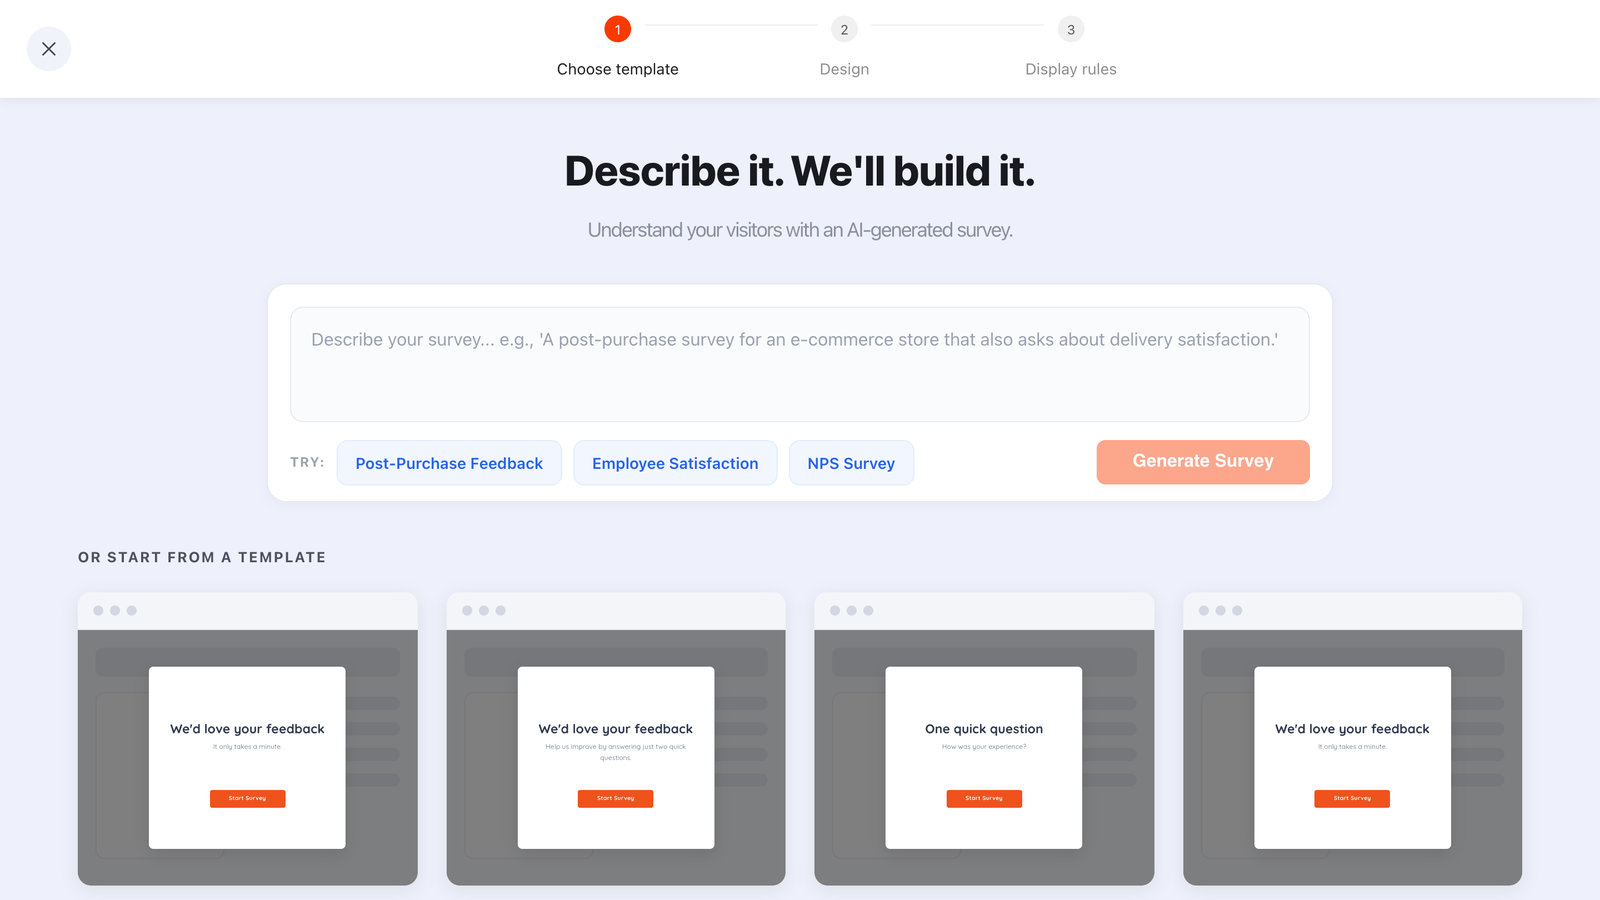
Describe the NPS survey in a sentence and edit the draft — faster than starting from a blank canvas.
2. Configure the NPS scoring block
On the question step, add a scoring block and pick the NPS variant — the 0–10 scale. Then three settings that each carry weight:
- Endpoint labels: set them to "Not at all likely" and "Extremely likely". Without anchors, people invent their own meaning for a 5 and your buckets stop being comparable.
- Required: on. The score is the one answer the survey exists to collect — the required toggle blocks advancing until it's tapped.
- fieldKey: name it something you'll recognise in exports, like
nps_score. This is the column your answer counts appear under.
3. Add the follow-up and email steps
Next step: a text input asking "What's the main reason for your score?" — optional, as argued above. Then an optional email input: "Want us to follow up? Leave your email." The email field is what makes closing the loop possible later; keeping it optional and last means it never costs you a score. Set the email input's validation to match your audience — format-only for consumers, business-email if you're B2B and want work addresses.
4. Keep the thank-you screen short
"Thank you — a human reads every answer." Then make that true. One design note: the thank-you screen can fire confetti, which is lovely for a quiz and tone-deaf for someone who just gave you a 2. For an NPS survey, keep the celebration off and the gratitude plain — the same screen shows to every respondent regardless of score.
5. Set who sees it, where and how often
This is the step that decides whether your data is readable — the next section covers the strategy,
but mechanically: target the right pages with URL rules (e.g. URL contains
/order-confirmation), pick your audience (returning visitors, defined in days),
trigger on a short time delay rather than exit intent, set frequency to once every 90
days, and turn off "show again after conversion" so anyone who submitted
is never asked again. Device toggles let you check the mobile layout actually fits before you
include phones.
Who to ask, and when
NPS measures loyalty, and loyalty requires experience. The single biggest error in on-site NPS is showing the recommend question to people who have nothing to base an answer on. Ask "would you recommend us?" to a first-time visitor eight seconds after they land and you're polling strangers about a relationship that doesn't exist.
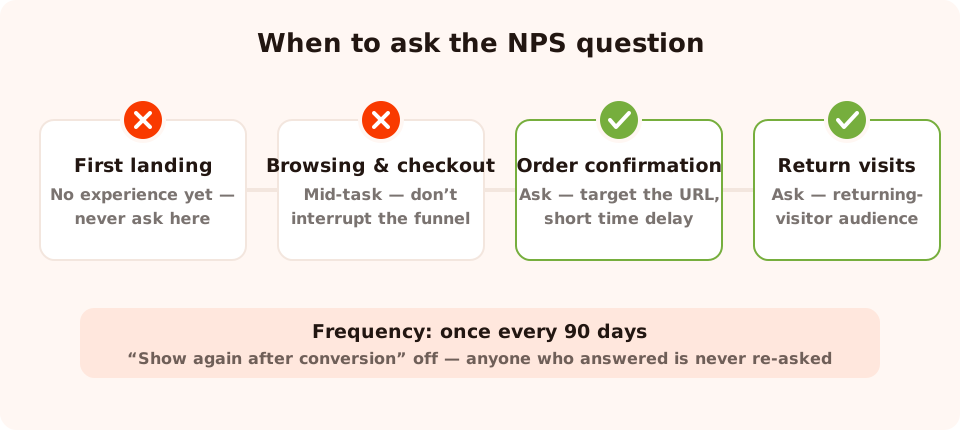
Ask where experience exists: after a completed purchase and on return visits — never on first landing, never twice in a quarter.
Three moments that produce answers worth reading:
- After a completed purchase. Target the order-confirmation URL — a rule like URL
contains
/order-confirmationor starts with your thank-you path — with a few seconds of delay so the page settles first. The customer has just experienced the whole funnel, and the confirmation page is a natural pause where a one-question overlay reads as reasonable rather than rude. - Returning visitors. Set the audience to returning visitors, defined in days. Someone back for the third time in a month has formed an opinion, even without buying — content sites and SaaS marketing sites should lean on this moment since they may have no order-confirmation page at all.
- A milestone page. Any URL that implies completed experience: a subscription management page, a re-order screen, a downloads area. Page targeting rules (contains / is exactly / starts with / ends with) let you pin the survey to exactly those.
And two frequency rules that protect both the data and the relationship:
- Cap it at once a quarter. Set the display frequency to once every 90 days, so even someone who dismisses the survey without answering isn't nagged again for three months. Asking more often doesn't just annoy people — it biases your sample toward the über-engaged and the freshly-irritated.
- Never re-ask a respondent. Turn off "show again after conversion": anyone who submitted stops seeing the survey entirely. Between the two switches, each visitor gets at most one ask per quarter and at most one answer, ever, until you deliberately relaunch.
Trigger choice matters here too. Exit intent — the trigger of choice for offers — is the wrong tool for NPS: you'd be systematically sampling people at the moment of leaving, which skews negative, and it's unreliable on mobile anyway. Use a short time delay on a targeted page instead. And if you're torn on how short — four seconds or ten? — that's a clean A/B test: run the two delays as variants and keep whichever gets more people to answer. Expect it to take a while, though: with a 90-day frequency cap the sample builds slowly, and the results view won't call a winner until each variant has at least 100 views and the test has 20 submissions between them — the same patience the score itself demands. Our popup triggers guide covers the full trigger menu and when each one earns its keep.
Segmenting and reading the responses
A single blended score hides more than it shows. Before you read the number, split the responses along the seams the dashboard already gives you:
- Desktop vs mobile. The analytics split every survey's results by device. A score that's healthy on desktop and ugly on mobile isn't a loyalty problem — it's a mobile-experience problem wearing a loyalty costume, and it has a very different fix list.
- By placement. If you run the survey in more than one moment — post-purchase and returning-visitor, say — build them as two separate surveys rather than one with broad targeting. Each gets its own response set, so you can see that (for example) post-purchase answers run warmer than cold return-visit answers, instead of averaging the two into mush.
- Per-question drop-off. The dashboard ranks where people quit, based on the last field they touched. If respondents tap a score and then bail on the follow-up in droves, your follow-up step is too heavy — shorten the question, or check it renders comfortably on a phone keyboard.
- Partial responses. Answers entered before someone left without submitting are still recorded. For NPS this is quietly important: a visitor who taps a 3 and closes the overlay still told you something — and if your partials skew low, angry people are quitting before the submit, which means your submitted-only score is rosier than reality.
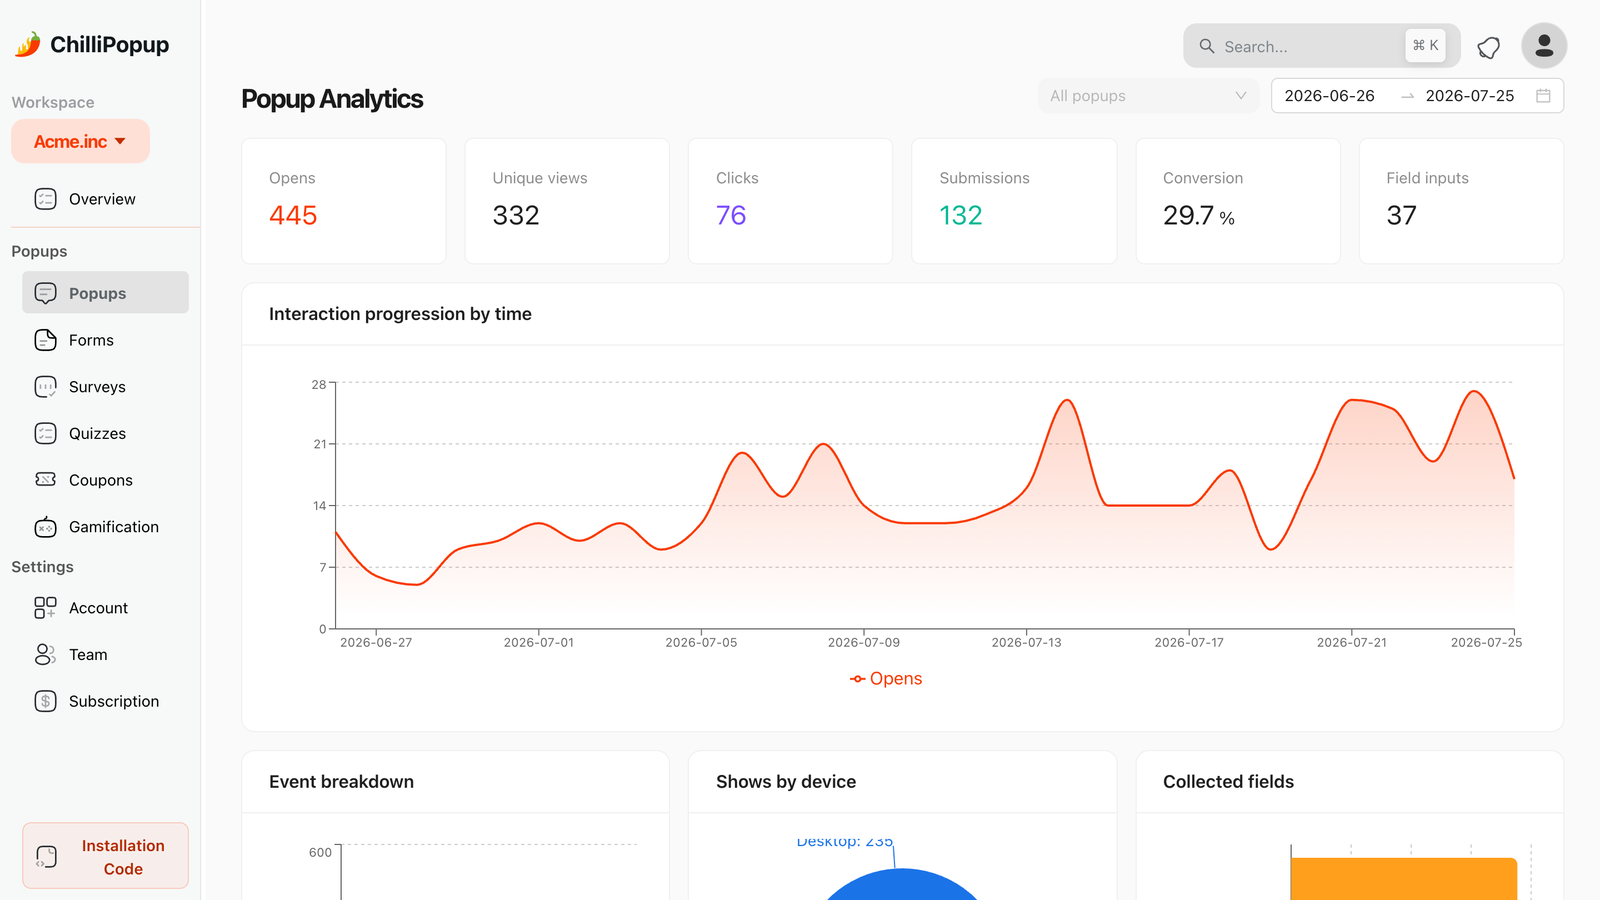
Views, submissions, conversion rate and the views → interactions → abandoned → submissions funnel — the context your score lives in.
The funnel itself — views → interactions → abandoned → submissions — plus completion rate and average time to finish tell you about the survey, as distinct from the sentiment. A 20-second average completion means your survey is as light as promised; a long tail of abandons at the email step means the email ask is scaring people off. Friendlier copy might fix that — or the step might simply cost more responses than it returns, which is a testable question: create an A/B test on the survey, drop the email step from variant B, and compare completion rates side by side. One rule: judge the variants on completion rate only. Never go shopping between variants for the one that reports a prettier score — that's inflating the thermometer, not measuring loyalty. For a deeper tour of these numbers, see the popup analytics guide.
How to read the score honestly
NPS has a well-earned reputation for being gamed, over-read and misquoted. Four disciplines keep yours honest:
Respect small samples
Because the score is a difference of two percentages, it swings violently at low volume. With 20 responses, each person is worth 5 points of score — one grumpy afternoon can look like a loyalty crisis. Treat any period with fewer than about a hundred responses as directional, widen the window (roll up to the quarter instead of the month) until the sample is readable, and never celebrate or panic over a single period's move.
Name your bias
On-site NPS samples visitors who came back and chose to answer. That's not your whole customer base: the silently churned never see the survey, and the mildly indifferent skip it. This doesn't make the data useless — it makes it comparable only to itself. Which leads to the rule that matters most:
Trend beats absolute number. "+26" means little on its own. "+26, up from +18 two quarters ago, collected the same way on the same pages" means a lot. Keep the survey, the targeting and the timing constant, and read the direction — the moment you change how you collect, draw a line in the chart and stop comparing across it.
Be suspicious of benchmarks
Published NPS benchmarks vary enormously by industry, by country and — most of all — by collection method: scores gathered by email, in-app and on-site aren't comparable even for the same company in the same month. Treat industry figures as folklore unless you know exactly how they were collected. We won't quote any numbers here for exactly that reason: your only clean benchmark is your own previous score, collected the same way.
Read the buckets, not just the score
The same +20 can be "polarised" (lots of promoters, lots of detractors) or "beige" (few of either, a sea of passives). The first needs firefighting; the second needs a reason to care. The score can't tell them apart — the three bucket counts, which you already have from the calculation, can.
Closing the loop with detractors and promoters
An NPS survey that ends at a spreadsheet is a thermometer. The value shows up when someone acts on individual responses — which is why the optional email step earns its place:
- Detractors who left an email are gifts. Most unhappy customers leave silently; this one told you the score, the reason and how to reach them. Reply personally within a couple of days — not a template, not a coupon-first apology. Read their follow-up comment before you write. A recovered detractor is often more loyal than someone who never had a problem, because you proved you listen.
- Promoters who left an email are volunteers. They just told you, in writing, that they'd recommend you. Make that easy: a short thank-you with a review link, or a referral nudge if you run one. Ask within days of the response, while the enthusiasm that produced the 10 is still warm.
- Passives get the roadmap, not a reply. Individually chasing 7s and 8s rarely pays. Collectively, their comments tell you what "fine but not remarkable" is missing — feed the themes into the product list instead.
Mechanically: read the submissions in the dashboard, where the score, the comment and the email arrive together as one response, and copy the ones that need action into your email tool to send the follow-ups. It's manual, and for the volumes an on-site survey produces, manual is fine — the bottleneck in loop-closing has never been tooling, it's whether anyone is assigned to do it. Give the job a name and a weekly slot.
A worked example: the full survey, word for word
Here's the complete copy for a post-purchase NPS survey for a fictional coffee-gear store, exactly as you'd type it into the editor:
Start screen — headline: "One question about your order?" Body: "20 seconds, no marketing, a human reads every answer." Button: "Go on then".
Step 1 — the NPS question (scoring block, NPS variant, required): "How likely are you to recommend us to a friend or colleague?" — endpoints "Not at all likely" (0) and "Extremely likely" (10).
Step 2 — the follow-up (text input, optional): "What's the main reason for your score?" — placeholder: "The one thing that decided it…"
Step 3 — the email (email input, optional): "If you'd like a reply, leave your email — otherwise just skip this."
Thank-you screen: "Thank you. Every answer lands in front of a real person this week." No confetti.
Display rules: page URL contains /order-confirmation · trigger:
4-second time delay · audience: everyone (the page itself guarantees a purchase) · frequency:
once every 90 days · show again after conversion: off · devices: desktop and mobile, after checking
the 0–10 scale fits a phone screen in preview.
Why this works: the ask is honest about its size, the required field is the one that matters, everything else is optional, and the rules mathematically guarantee no customer is asked more than once a quarter or after they've answered. That restraint is what keeps response quality high enough to act on.
Six mistakes that ruin NPS surveys
- Asking too early. First-landing NPS polls strangers. No experience, no loyalty, no signal — just noise wearing a score. Gate the survey behind a purchase or a return visit, always.
- Leading copy. "How likely are you to recommend our award-winning service?" isn't a question, it's a nudge — and every point of inflation it buys makes the trend line less trustworthy. Use the standard wording and neutral endpoint labels.
- Bribing the score. "Complete our survey for 10% off" is fine when the incentive rewards completion. "Rate us 9 or 10 and get…" is score-buying: your number goes up, your information content goes to zero, and the detractors you no longer see are still out there telling their friends.
- Surveying everyone, every visit. No frequency cap means your most loyal visitors get asked most often — and learn to dismiss you on reflex. Once every 90 days, conversion re-show off, no exceptions.
- Shipping the scale without the "why?". A score with no follow-up is a thermometer with no diagnosis. You'll know something changed and have no idea what — which is how teams end up arguing about causes in a meeting instead of reading them in the responses.
- Treating the number as the deliverable. If the score gets reported and nothing else happens — no detractor replies, no themes tallied, no fix shipped — the survey is theatre. Respondents notice, and next quarter's response rate pays for it.
Put a number on loyalty this week
Build popups, forms, surveys, quizzes and games from one editor — and one pixel. Free plan, no credit card required. Paid plans from $29/month.
Start free →Related reading
Frequently asked questions
What is a good NPS score?
Any score above zero means you have more promoters than detractors, and higher is better — but a "good" score depends on your industry, your audience and how you collect responses. On-site surveys, email surveys and in-app surveys attract different respondents, so their scores are not comparable. Benchmark against your own previous quarters, collected the same way, rather than against numbers published for other companies and other channels.
How do you calculate NPS?
Group the 0–10 answers into promoters (9–10), passives (7–8) and detractors (0–6). Then subtract the percentage of detractors from the percentage of promoters: NPS = %promoters − %detractors. Passives count in the total but sit out of the subtraction. The result runs from −100 (everyone is a detractor) to +100 (everyone is a promoter). In ChilliPopup you read the 0–10 answer counts from the survey's collected-fields breakdown and do that arithmetic yourself, for example in a spreadsheet.
How often should you run an NPS survey on your website?
Ask each visitor at most once a quarter. Set the survey's frequency rule to once every 90 days and turn off "show again after conversion" so people who already answered are never re-asked. Continuous collection with a per-person cap beats a once-a-year blast: you get a steady trickle of responses you can trend month over month instead of one giant, dated sample.
What is the difference between NPS and CSAT?
CSAT measures satisfaction with one specific interaction — "How satisfied were you with your delivery?" on a 1–5 scale, asked right after the event. NPS measures overall loyalty to the brand — "How likely are you to recommend us?" on a 0–10 scale, asked periodically. Use CSAT to grade a touchpoint and NPS to track the relationship. They answer different questions, so most sites end up running both.
How many NPS responses do I need before the score means anything?
More than most teams want to hear. Because NPS is a difference of two percentages, small samples swing wildly — with 20 responses, one person moving from passive to detractor shifts the score by 5 points on its own. Treat scores built on fewer than about a hundred responses per period as directional at best, widen the reporting window until each period has a readable sample, and watch the trend rather than any single number.
Should the NPS follow-up question be required?
No — keep it optional. Making the "why?" question required trades response volume for comment volume: some people who would happily tap a number will abandon rather than write a sentence. An optional open-text step still collects reasons from everyone with something to say, and in ChilliPopup a partial response records the score a visitor tapped even if they leave before finishing the comment step.